Mainstream Separately Managed Accounts allow clients to follow Rivkin’s proven investment strategies without having to trade themselves. Our four portfolio options have been designed to suit various different investor goals.
Monthly Update June 2022
The end of June marks the halfway point for the 2022 calendar year, one that has been a difficult one for equity investors, and June was no exception. The major themes that have been pressuring equity prices lower have been elevated levels of inflation, increasing bond yields (interest rates), and, more recently, signs of slowing economic growth. To provide some context, in the US, the S&P500 is down year-to-date 20.6% as of June 30, the weakest start to a calendar year since 1962 and the fourth weakest on record since 1928. The Nasdaq100 has performed worse still, down 29.5% over the same period. In Australia, the falls have been less severe, with the ASX200 Accumulation Index declining 9.9% to June 30, with the Information Technology sector the worse performer, down 37.4%. Locally, the only sectors to return positive performance over the past six months have been energy (+26.9%) and utilities (+13.4%).
Despite the tough start to 2022, there are now several factors that shift the probabilities towards a much better six months ahead. These can be broadly characterised as an easing of economic headwinds on the one hand, while on the other hand, historical market performance and current seasonality. In terms of the current economic headwinds, we are starting to see an easing in inflationary pressures, across several major economies, both in terms of reported producer prices and forward pricing from inflation-linked bonds. Not to mention the price of Crude Oil, which, as we write, is trading back below US$100 a barrel. Added to this, bond yields started to ease during the second half of June. Using the 10-year government bond yields as a proxy, rates peaked at 3.5% in the US and 4.26% in Australia during June. However, both have since eased considerably, to be back at 2.93% and 3.46%, respectively.
This means that, although official cash rates, as determined by Central Banks, are likely to keep going up over the coming months, the bond market is suggesting that the ultimate peaks will likely end up lower than initially anticipated. As such, futures markets have begun pricing in interest rates both in Australia and the US during the latter half of 2023 on expectations deteriorating economic growth will lead to a dovish pivot, which has begun to dominate the high inflation narrative increasingly.
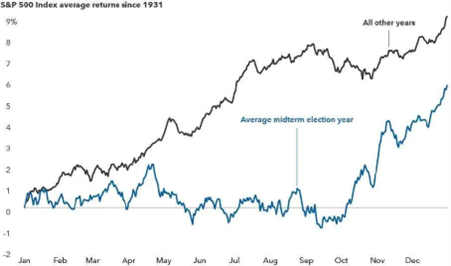
Now looking at both historical analogues and current seasonality and cycles. Table 1 shows the top 10 worst performances for the S&P500 during the year’s first half, followed by how the Index performed during the remainder of the year. As shown, substantial falls have been followed by a decent recovery into year-end. Furthermore, chart 2 shows the average return for the S&P500 during the mid-term election year, which 2022 is one. As shown, returns during the midterm election year tend to be well below average, with 2022 appearing to confirm this trend. However, often early weakness gives way to a strong recovery into year-end. All in all, while it is too easy to extrapolate recent performance into the future, we believe it is more likely to see a price recovery than further falls into the end of the year.
Table 1
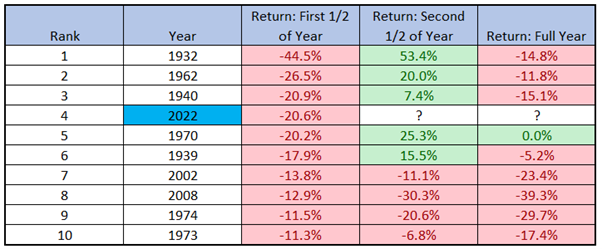
Chart 1
To the performance of the portfolios, Rivkin offers four options on the Mainstream Self-Managed Account (SMA) platform: ASX Growth, ASX Income, US Growth, and Low Volatility. Despite all portfolios ending the month lower, the one positive that we can take away is that they all fell less than the broader market indices. Regarding the Australian-focused portfolios, ASX Income and ASX Growth declined 4.70% and 7.71%, respectively, net of fees. The US Growth portfolio declined 2.02% net of fees, while the Low Volatility declined 1.25% net of fees.
For the ASX Growth portfolio, although the prices of many growth companies followed the market lower in June, we are seeing many companies begin to out-perform on a relative basis. In other words, fall less than the broader market. We view this as a pretty positive sign that plenty of pessimism has been priced into growth companies in general, increasing the probability that the worst is clearly behind us. The largest detractors from the portfolio were South32 (S32, -21.2%) and Hub24 (HUB, -16.4%), while Woodside Energy (WDS, +7.0%) and Computershare (CPU, +6.2%) were the top gainers.
Regarding ASX Income, the Blue-Chips component of the portfolio, which is approximately 50% of the total portfolio was lower, led by some of the larger cap financials, such as Westpac Banking (WBC) and National Aust. Bank (NAB), which fell 18.3% and 12.4%, respectively. Nevertheless, the portfolio offers a lower volatility approach than the broader market, thanks to the approximately 30% allocated to ASX Events. During June, the Events essentially performed to expectations. Our investment in Link Market (LNK) has become complicated, although recent events have improved the odds that the result will be tolerable. The investment in the Crown Hybrids (CWNHB) went precisely to plan, and we will see redemption at the end of July, with total payment of $102.75, marking a 6+% return over only a few months of holding. We have also seen the Virtus (VRT) investment conclude, with a small profit recorded. There are several offers at the due diligence stage, which ideally will progress to give us some new opportunities in the short-term. The goal remains to buy into these at attractive annualised returns.
The US Growth portfolio continues its somewhat defensive stance, with the Momentum component current comprised of three ETFs, comprised of short-dated bonds, gold, and the US Dollar Index, as opposed to the usual top seven momentum stocks. This is a quantitative switch that we initiate from the broader trend in the S&P500 turns down and aims to limit the depth of any drawdown. As a reminder, this portfolio is also unhedged, meaning it benefits during times of a weaker Australian Dollar, which was the case in June, with the AUD declining 3.8% against the USD.
Finally, regarding the Low Volatility portfolio, both bond and equity prices continues their downward path in June, with the three equity ETFs held falling an average of 4.7%. Corporate Bonds (CRED) fell 3.1%, while Aust Government Bonds (VAF) fell 1.8%. Regarding our current bond exposure, we made the decision to switch out of the Hybrid ETF back into both CRED and VAF, with the view that with yields correcting, there is a high probability of making attractive capital gains while picking up an acceptable yield at current levels. Gold priced in Australian dollars was higher for June, shielding the portfolio somewhat.
Looking forward, with the inflation outlook beginning to ease, we expect a further reduction in bond yields over the coming months and, as a result, expect official cash rates to level off before the end of the year. And with many growth style names starting to out-perform the broader indices on a relative basis, we believe many of these companies are again looking very attractive.
All performance data presented in this document relates only to the start date of the SMA portfolios, being June 2019 for ASX Income and Low Volatility and July 2021 for ASX Growth and US Growth. The performance below refers to the model portfolios, net of both management and performance fees, which will not match exactly everyone’s account while providing an accurate representation. Please use the investor portal or call us to check your account-specific performance.
*Past performance is not indicative of future performance. The inception date for ASX Growth and US Growth is 1 July 2021. Low Volatility and ASX income inception date is 12 June 2019
The above table shows the returns of each portfolio, being ASX Growth, US Growth, ASX Income, and Low Volatility, over various time periods after brokerage, management, and performance fees. Individual account performance may vary from the results above due to a number of factors including, but not limited to, rounding, small variations in stock weightings, and account start date. Please log in to your Mainstream Account to have the most accurate picture of your account’s performance.
Please note that we don’t have historical data for the ASX and US Growth portfolios, as were included in the SMA offering from 1 July 2021 whereas ASX Income and Low Volatility remain unchanged.
For those interested in the historical performance of the individual strategies, please click here
| 2019 | 2020 | 2021 | Jan | Feb | Mar | Apr | May | Jun | Jul | Aug | Sept | Oct | Nov | Dec | |
| ASX Growth | 10.17% | -12.90% | -2.99% | 7.13% | -4.91% | -6.09% | -7.71% | ||||||||
| US Growth | 9.88% | -2.72% | -3.23% | -0.70% | -2.68% | 0.42% | -2.02% | ||||||||
| ASX Income | -1.51% | 0.16% | 18.10% | -1.74% | 1.46% | 3.31% | -1.07% | -1.61% | -4.70% | ||||||
| Low Volatility | 5.87% | 6.47% | 4.95% | -1.48% | -0.45% | -0.35% | -0.16% | -2.36% | -1.25% |
*Past performance is not indicative of future performance. The inception date for ASX Growth and US Growth is 1 July 2021. Low Volatility and ASX income inception date is 12 June 2019.
Note: All returns in this document are net of fees, 1.5% management fee (1% for capital Stable); and 10% performance fee where applicable with high watermark ( 5% for capital stable) for the complete list of the fees please refer to the PDS issued by The Trust Company (RE Services) Limited a part of the Perpetual Group.
*$70,000 for US Growth
**5.0% for Low Volatility
****1.0% for Low Volatility
The PDS and target market determination can be obtained by calling 02 8302 3600 or visiting our website.
This information has been prepared and issued by Rivkin Securities Pty Ltd (ABN: 87123290602, AFSL: 332 802).
Important Notice: Please consider your own financial situation before investing in our products. Rivkin does not provide personal financial advice and does not take anyone’s personal financial situation into account when structuring its model portfolios.
Past performance and/or backtesting is not a guarantee of future performance. Investing and trading carry financial risk, when judging performance please consider the different types of investments and levels of risk associated.
The Trust Company (RE Services) Limited (ABN 45 003 278 831, AFSL 235150) (part of Perpetual Group ABN 45 003 278 831 AFSL No 235150) is the responsible entity and the issuer of units in the Mainstream Separately Managed account. It is general information only and is not intended to provide you with financial advice, and has been prepared without taking into account your objectives, financial situation or needs. You should consider the product disclosure statement, available on www.rivkin.com.au, prior to making any investment decisions. If you require financial advice that takes into account your personal objectives, financial situation or needs, you should consult your licensed or authorised financial adviser. To the extent permitted by law, no liability is accepted for any loss or damage as a result of any reliance on this information.
All opinions and estimates constitute judgments of Rivkin and are subject to change without notice. These statements should therefore not be relied upon as an accurate representation or prediction as to any future matters. No company in the Perpetual Group (Perpetual Limited ABN 86 000 431 827 and its subsidiaries) guarantees the performance of any fund or the return of an investor’s capital. Past performance is not indicative of future performance.
PERPETUAL BEING THE ISSUER AND RESPONSIBLE ENTITY UNDER The Trust Company (RE Services) Limited (Perpetual, Responsible Entity, RE, we, us or our), part of the Perpetual Group ABN 45 003 278 831 AFSL No 235150

